Household finances stable as inflation anxiety rises
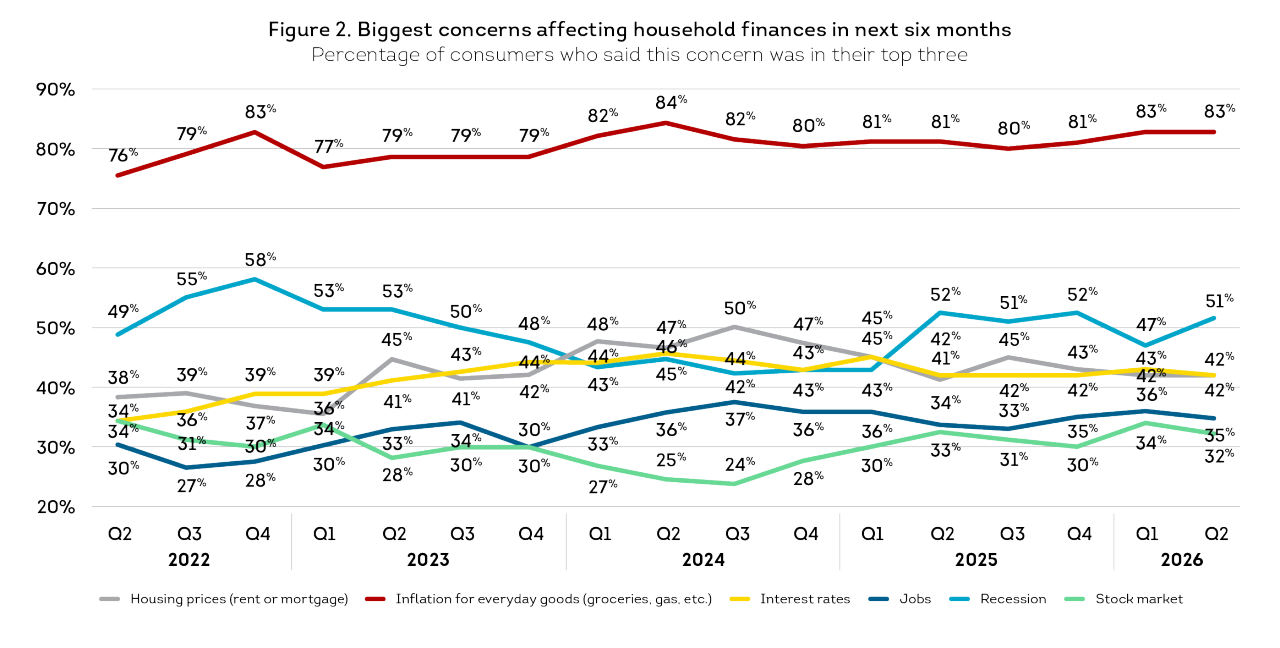
Inflation and affordability have dominated the US consumer mindset since the end of the COVID-19 pandemic. In Q2 2026, US households appeared to be maintaining their financial standing despite economic headwinds, but high-income consumers showed some strain. Rising prices and moderating income will impact discretionary spending and consumers’ ability to pay bills. While it’s yet to be seen when high gas prices will retreat, organizations should plan for inflation continuing to animate consumer behavior. In response, business leaders should reevaluate value — refining the balance of offer and price to better align with shifting consumer realties.
Cautious optimism persists as household finances remained steady
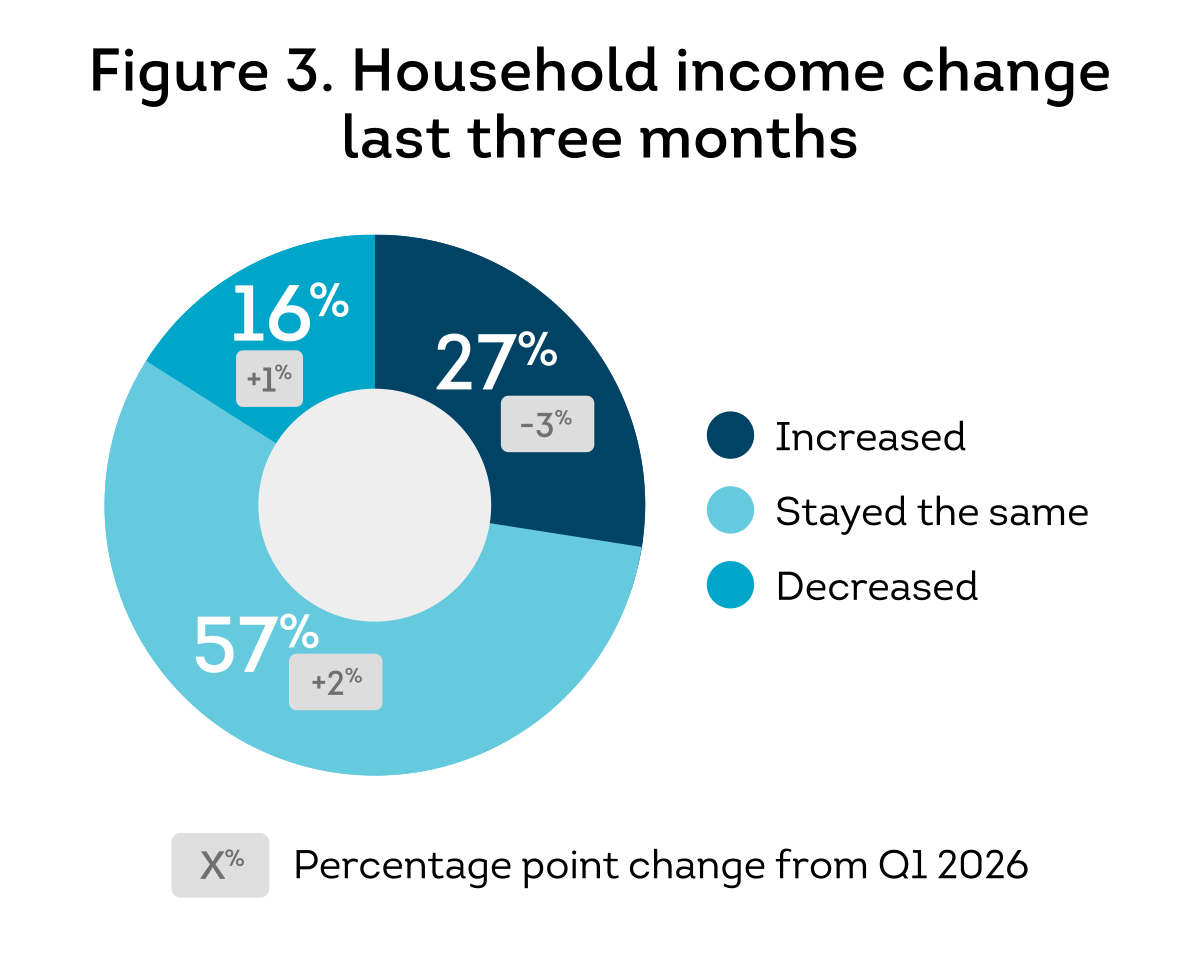
Consumers appeared to be managing through the spike in gas prices for the time being; 68% said their household finances were as planned or better. The longer-term trend was positive as those who responded “as planned” increased four percentage points from Q2 2025, but since last quarter, those who said their household finances were worse than planned jumped four percentage points.
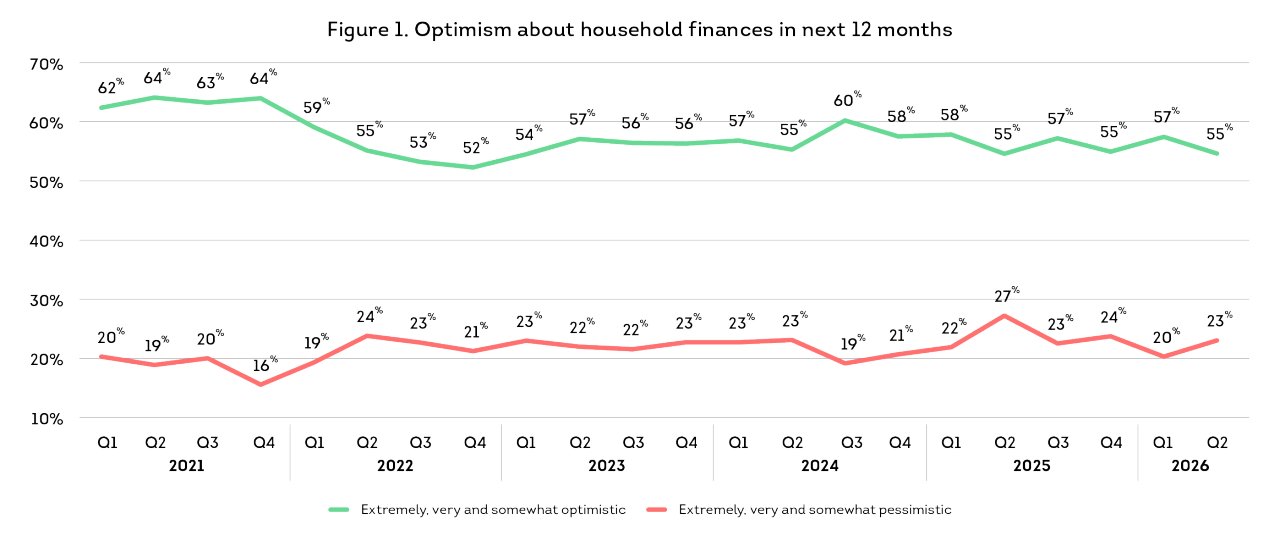
Consumers appeared resilient with more than half saying they were optimistic about their household finances in the next 12 months, unchanged since last year (Figure 1). At the same time, more consumers seemed ambivalent about their financial outlook; fewer American’s said they were pessimistic than a year ago and more indicated they were neither optimistic nor pessimistic (up four percentage points to 22%). Differences by generation tell a more nuanced story of consumer outlook. Optimism declined with age as Gen Z (68%) and Millennials (63%) had a significantly more positive outlook compared to Gen X (52%) and Baby Boomers (44%).