Consumer Pulse Study

Consumer behaviors and attitudes about current and future household budgets, spending and debt

3-dimensional graphs

US Q4 2026

  calendar-icon   November 18, 2026

Consumers Remain Financially Optimistic in the Face of Persistent Inflation

US consumers maintained a positive outlook about their household finances. Despite affordability pressures intensified by high grocery and gas prices (particularly for low- to medium-income households), consumers kept spending. This carried over to spending plans for the upcoming holiday season. While high-income households remained financially resilient, Gen Z stood out for income growth and financial optimism. The implication for business leaders is a resilient and responsible consumer confident about their future financial situation.

Key Takeaways

trend icon

Inflation concern hits all-time high, yet consumer optimism remained resilient

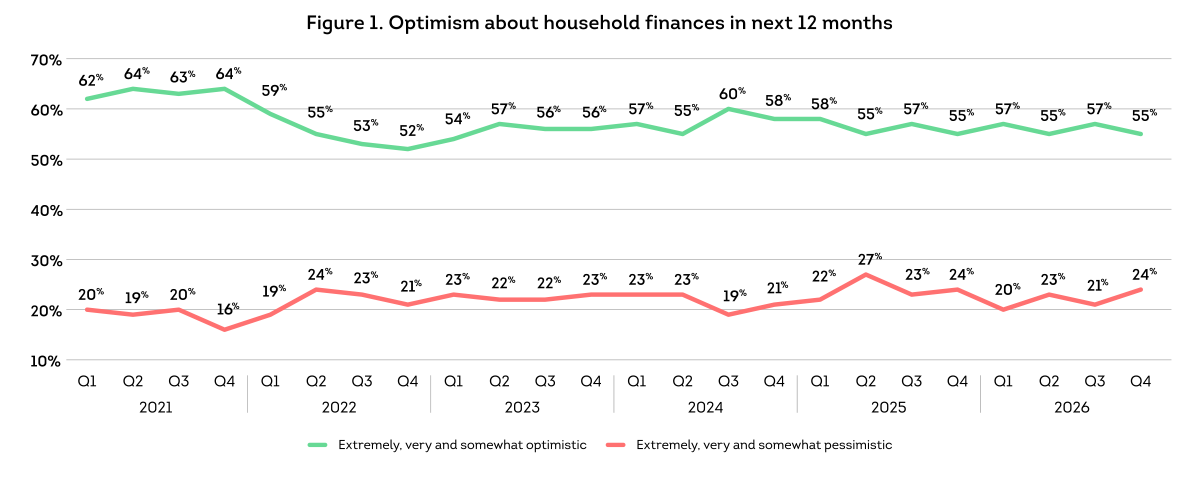
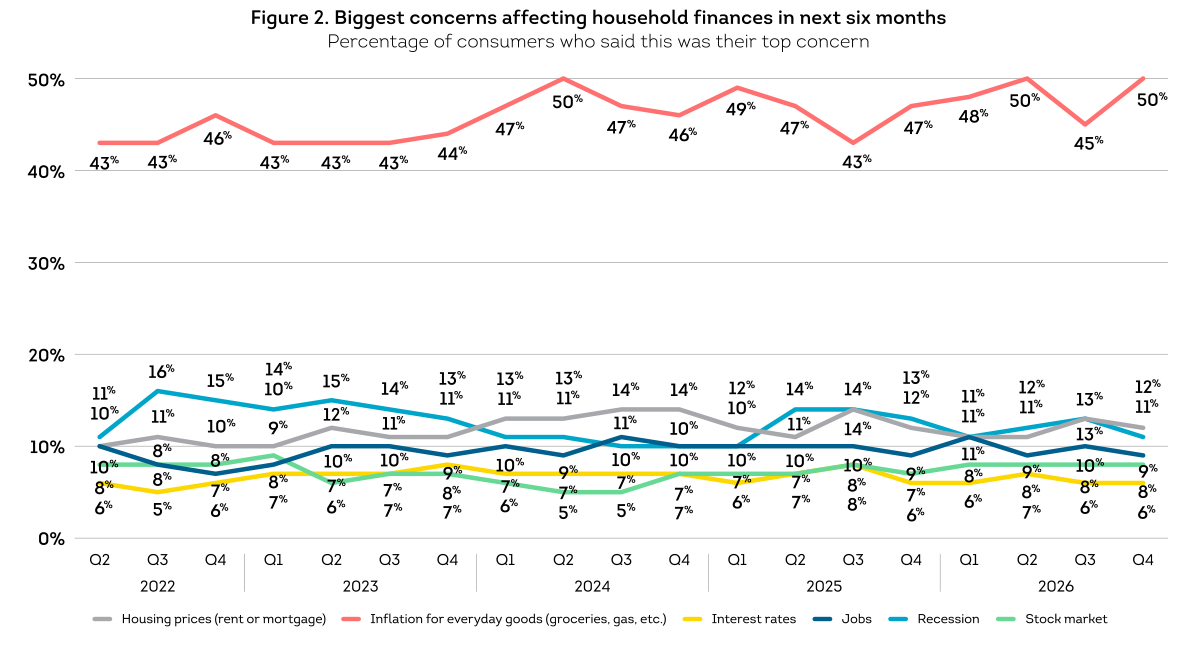
Half of consumers said inflation was their top financial concern in Q4 2026, matching the all- time-high in Q2 2024 and Q2 2026 (since TransUnion began measuring it). Inflation concern grew, up three percentage points from a year ago and five percentage points from last quarter. When asked which current price increases are very concerning, groceries (82%) and gasoline (76%) topped the list.  At the same time, Americans remained positive about the future with more  than half (55%) saying they were optimistic about their finances in the coming year, unchanged from Q4 2025. 

shopping bag icon

Holiday spending outlook bolstered by Gen Z and high earners

Overall, 58% of consumers said they planned to spend the same or more on holiday shopping, unchanged from last year. Gen Z (71%) and high-income households (72%) planned to spend  the same or more, the highest of any generation or income level. Looking at planned holiday spending by category, consumers said they’d spend the same or more on in-home holiday meals (the highest of any category) and gift cards, significantly higher than the average across all categories. While the majority of consumers planned to spend $500 or less on holiday shopping this year, a third said they planned to spend more than $500. 

financial strength

Gen Z demonstrated growing financial strength

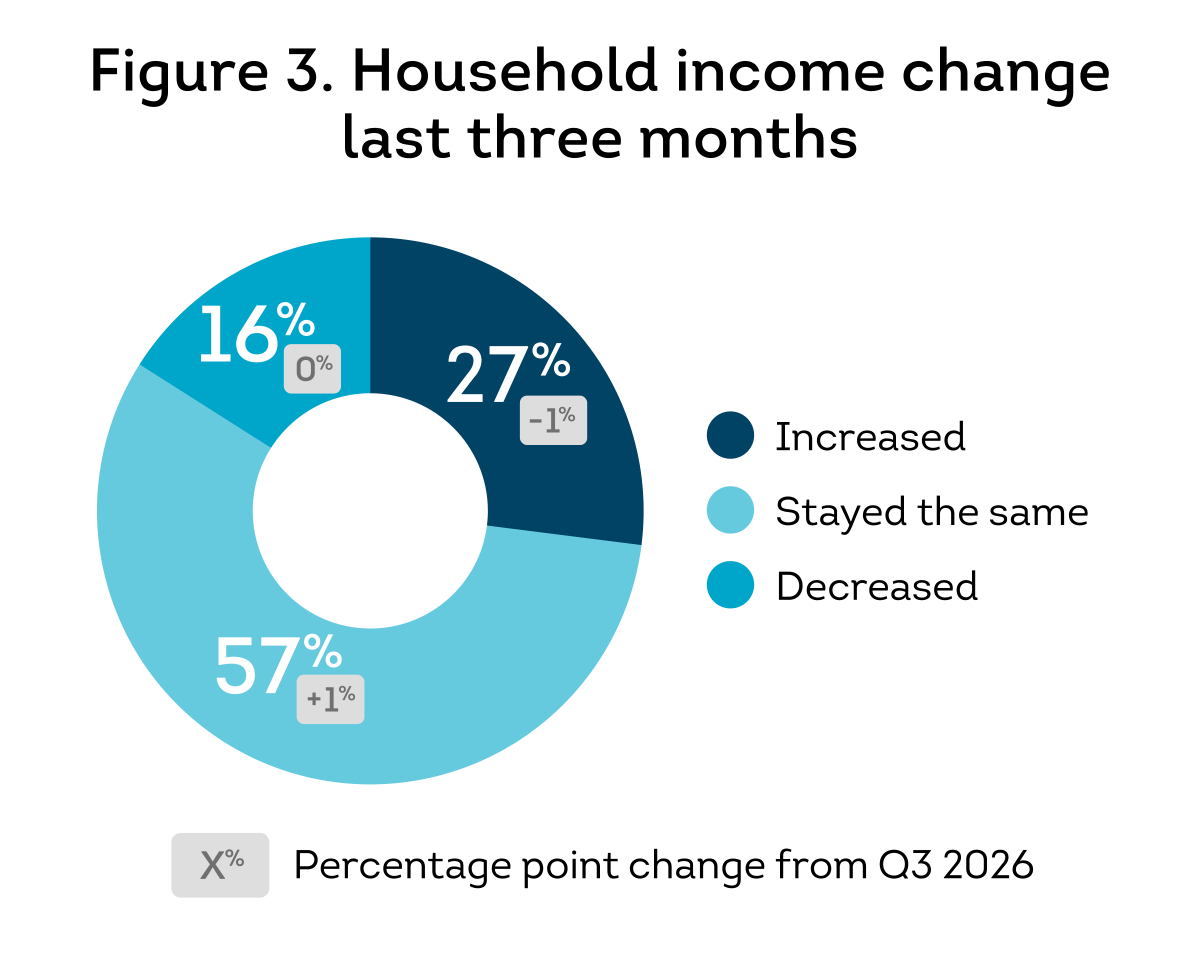
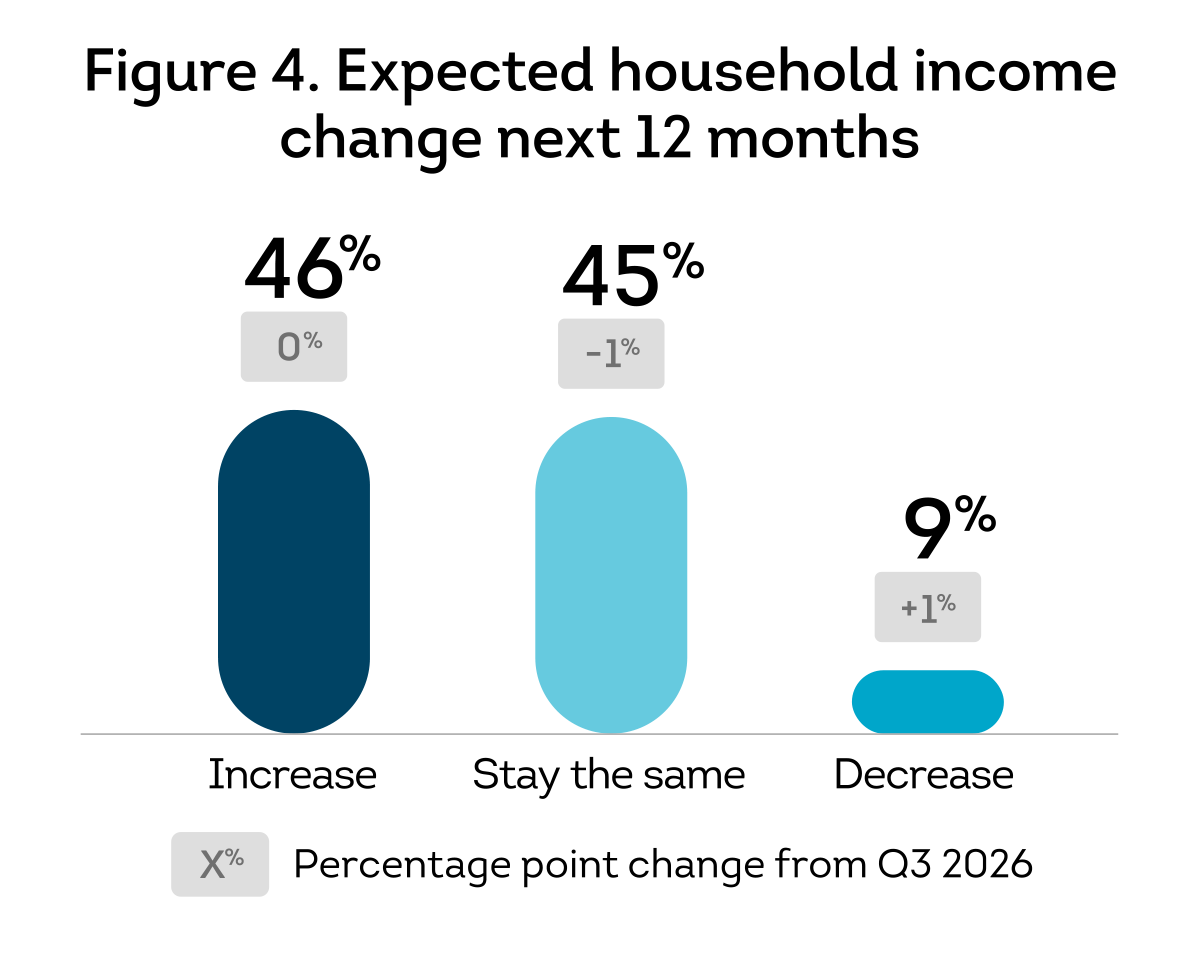
Nearly half (49%) of Gen Z consumers said their incomes increased in the last three months,  a seven-percentage point increase over last year, far outpacing the 27% of Americans overall  who said the same. This aligns with the 49% of Gen Z who said their household finances were  better than planned so far this year, also much higher than a year ago and other generations.  With 63% of Gen Z expecting their incomes to increase in the next 12 months, 68% said they  were optimistic about their finances in the next 12 months, up from 63% a year ago and leading  all generations for both questions. More than half (53%) of Gen Z said their household incomes  kept up with inflation, eight percentage points higher than last year, and significantly higher  than consumers overall (36%).

About the data

Unless otherwise noted, data cited throughout this report is drawn from a commissioned consumer survey.
For additional methodology details, including definitions of generations and income levels, see About the research.

Financial Health

Spending plans bolstered by positive financial outlook

Consumers continued to believe their household finances would improve in the coming year, demonstrating resilience in the face of a mixed economic picture. Inflation remained the dominant issue concerning Americans. While affordability is an ongoing concern, spending plans for the holiday shopping season and beyond were largely unchanged from last year. Organizations should respond with continued focus on value while pursuing the growing spending power of Gen Z as their incomes increase through career advancements.
 

Overall financial outlook remained positive, driven by Gen Z

When it comes to personal finances, Americans remained consistent in their belief they’ll be better off in the coming year. More than double the number of consumers were optimistic about their household finances in the next 12 months than pessimistic, unchanged from a year ago (see Figure 1). About two-thirds (67%) said their household finances were as planned or better so far this year, an improvement from 64% a year ago.

Optimism was driven by younger generations. When asked if they were optimistic about their household finances over the next 12 months, 68% of Gen Z and 63% of Millennials said they were compared to 52% of Gen X and 45% of Baby Boomers. While more than a quarter of Gen X and Baby Boomers were pessimistic about future finances, the percentage of Gen Z who were pessimistic fell five percentage points from  Q4 2025 to 14%. Gen Z’s financial optimism appeared to be driven by rising income. About half (49%) of Gen Z said their incomes increased in the past three months, much higher than other generations and far outpacing the overall population (see Figure 3). They also had much higher expectations for income growth in the coming year; 63% expected their incomes to increase compared to less than half of Americans overall (see Figure 4).

3360617-q4-consumer-pulse-fig1.png

Despite positive outlook, consumers are struggling with inflation and affordability

As it’s been for most of the decade, inflation was by far the biggest headwind for consumers, with half saying it’s their number one financial concern — matching the survey’s all-time high for the third time since Q2 2024 and since we began measuring in Q2 2022 (see Figure 2). The spikes in inflation concern appeared to highlight uncertainty among Americans, along with the financial strain from increased costs. Rising housing costs  and lingering COVID-era inflation in Q2 2024, the beginning of the Iran war in Q2 2026 and stubbornly high fuel prices in the second half of 2026 all seemed to elevate concern about the impact of price increases  on household finances.

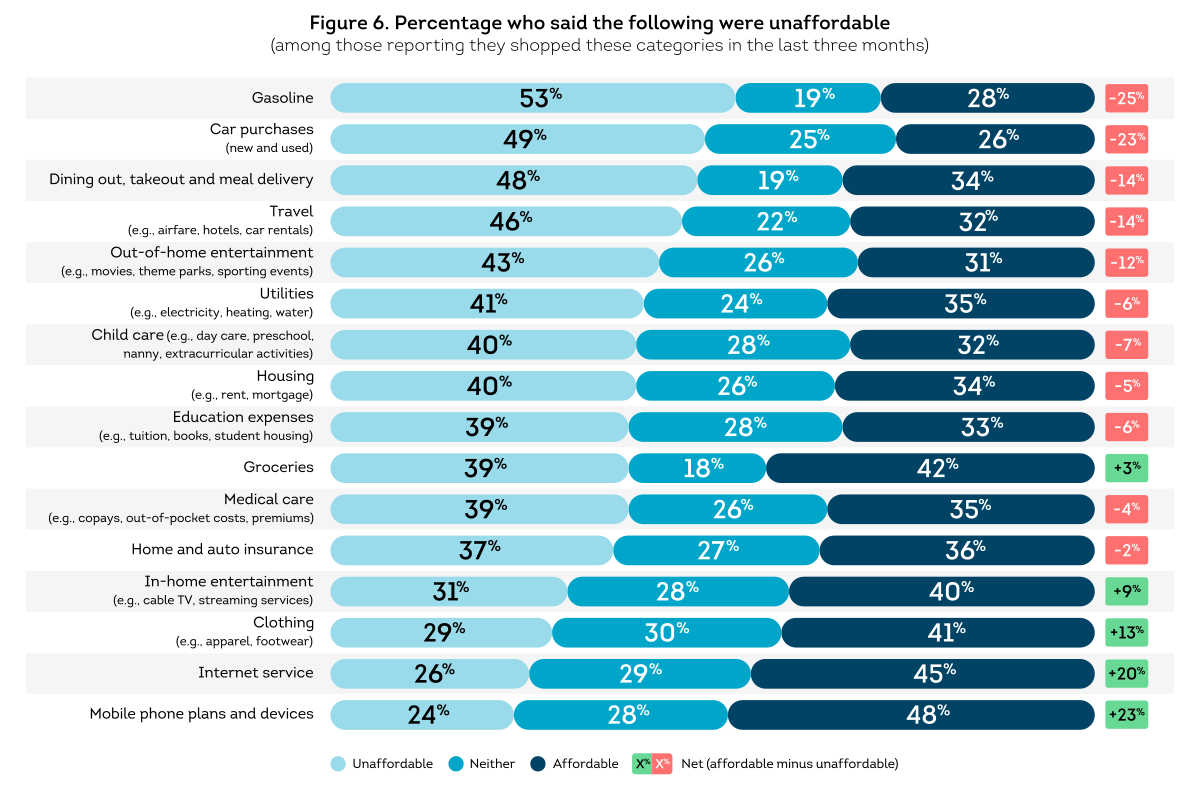
At the time of writing this report, a gallon of gas averaged $1.44 more than a year ago and diesel averaged $2.69 per gallon more.1 Those price increases alone had an impact; more than half (53%) of surveyed consumers said gas was unaffordable in the last three months. The effect on household finances is real for consumers if uneven for certain segments. More than a third (36%) reported their household incomes were keeping up with inflation, down four percentage points from last quarter and barely higher than 35% a year ago. High prices disproportionately affected low-income households; just 23% said their incomes kept up  with the rate of inflation, a drop from 26% a year ago. That’s compared to 48% of high-income consumers  who said their incomes kept up with inflation, up three percentage points from last year.

There’s also a large generational divide when it comes to inflation and household finances. Gen Z (53%) and Millennials (45%) reported their incomes kept pace with inflation compared to Gen X (31%) and Baby Boomers (26%). Gen Z fared particularly well year over year (YoY), showing an eight-percentage point increase in those who said their incomes kept up with inflation.

Gas topped the list of purchases consumers cited as the most unaffordable in the last three months followed by car purchases and dining out (see Figure 6). On the other hand, digital connectivity, including mobile phones and plans and internet service were viewed as the most affordable across 16 categories analyzed. Gen Z reported the lowest levels of unaffordability compared to all other generations across all categories.


3360617-q4-consumer-pulse-fig2.png
3360617-q4-consumer-pulse-fig3.png
3360617-q4-consumer-pulse-fig4.png
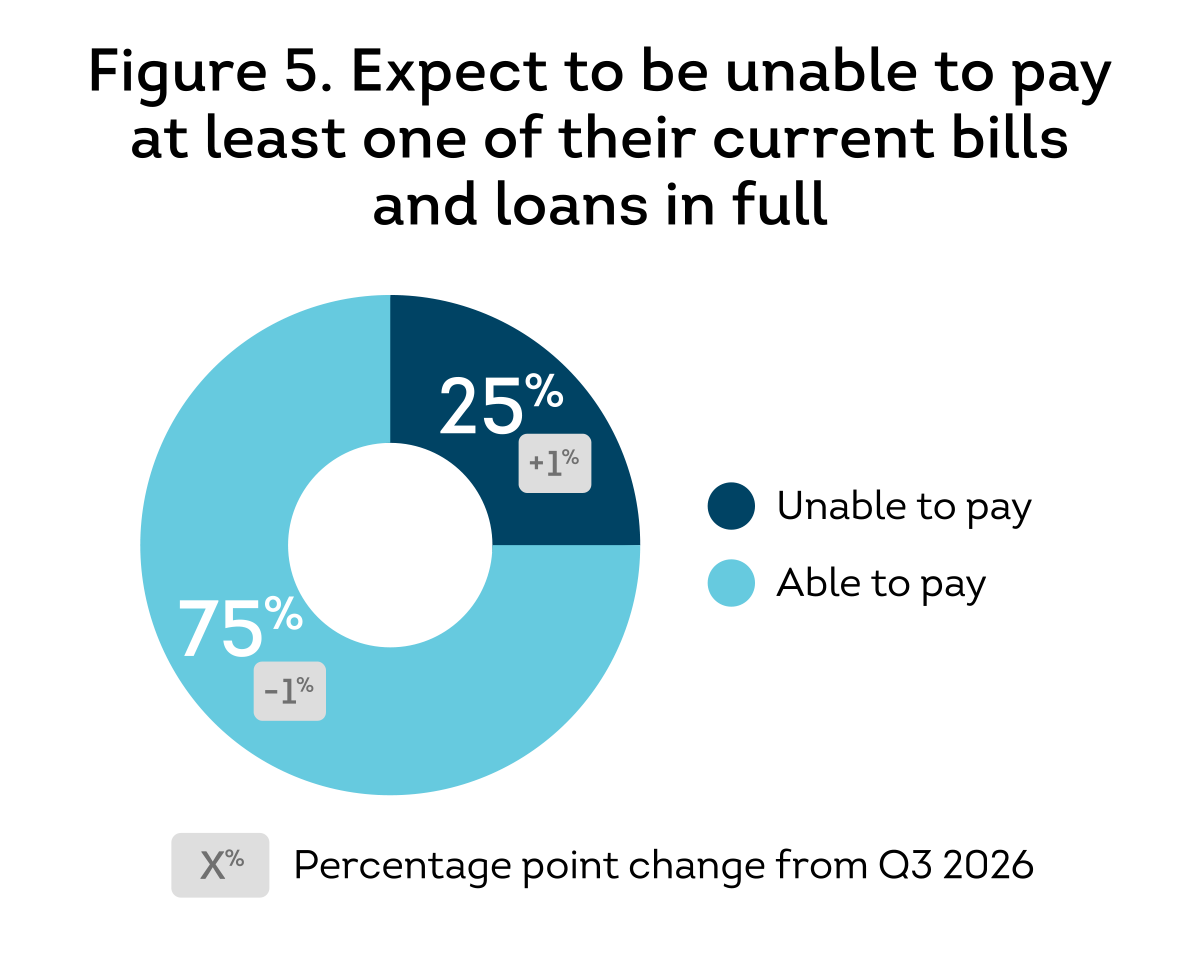
3360617-q4-consumer-pulse-fig5.png
3360617-q4-consumer-pulse-fig6.png

Overall and holiday spending plans stay steady

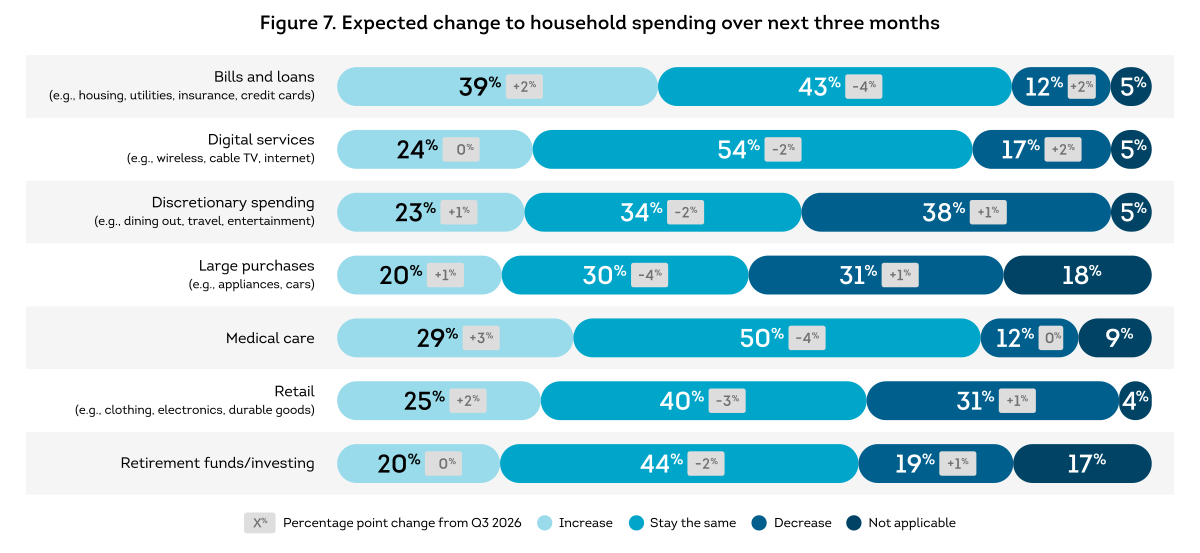
Despite higher prices impacting the affordability of many spending categories, consumer plans for purchases over the next three months (see Figure 7) barely changed from last quarter and last year.  Gen Z drove spending increases with planned increases in retail (40%, four percentage points higher YoY and five percentage points higher than last quarter); medical care (33%, five percentage points higher  YoY and four percentage points higher than last quarter); and large purchases (31%, six percentage points higher YoY and two percentage points higher than last quarter).

3360617-q4-consumer-pulse-fig7

More than half (58%) of consumers indicated they’ll spend the same or more than last year this holiday season, similar to a year ago. Categories that stood out for higher-than-average planned spending included in-home holiday meals (73% said they’ll spend the same or more on these this holiday season) and gift cards (70%). Considering their budgets for holiday spending, 33% said they planned to spend more than $500 this year compared to 31% last year.

Gen Z (23%) was nearly twice as likely to spend more this coming holiday season than the 12% overall who planned to spend more. In addition, the proportion of Gen Z consumers who planned to spend less this holiday season fell 10 percentage points year over year to 25%. Despite plans to spend more this holiday season, Gen Z (78%) was more likely to budget $500 or less for holiday spending than other generations: 67% of Millennials, 66% for Gen X and 65% for Baby Boomers. Baby Boomers (35%) led all generations planning to spend more than $500 this holiday season, five percentage points higher than Q4 2025.
 

Organizations need to focus on more precise engagement to support growth

Overall, organizations are faced with a consumer who’s resilient while confronting daunting inflationary pressures. While more (42%) consumers said their households didn’t keep pace with inflation compared  to those who did (36%), most remained optimistic about future household finances — and they’re holding the line on spending. Given consumers have similar spending plans for the 2026 holiday season compared to last year, organizations may face increased competition for budgets stretched due to rising prices.  In particular, identifying and effectively reaching Gen Z and high-income households is important for  long-term growth.

Financial Inclusion

Gen Z takes the lead in driving credit demand

In Q4 2026, Gen Z reported the healthiest household finances, highest income increases and most  ambitious spending plans. As organizations look for growth opportunities, they should consider how they can best serve the newest generation of US consumers growing into adulthood.
 

Credit intent holds steady despite rising interest rates

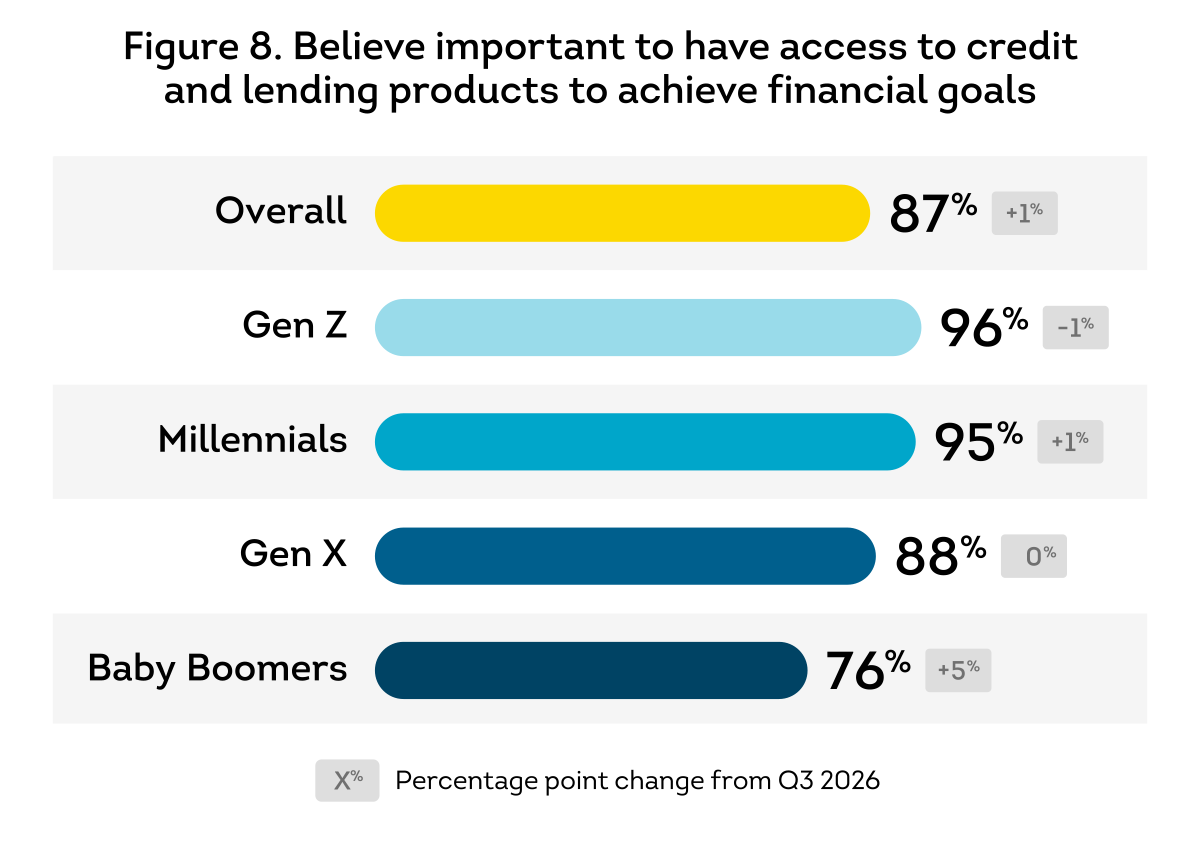
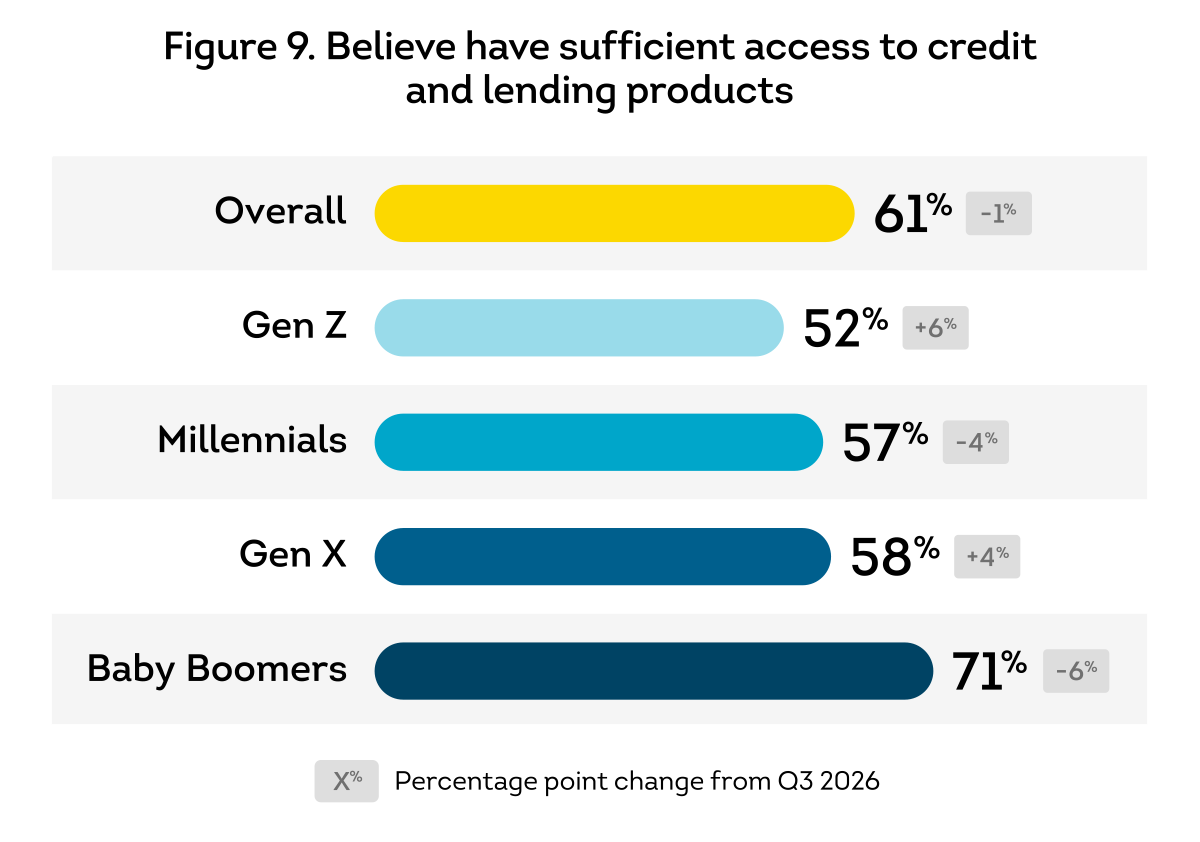
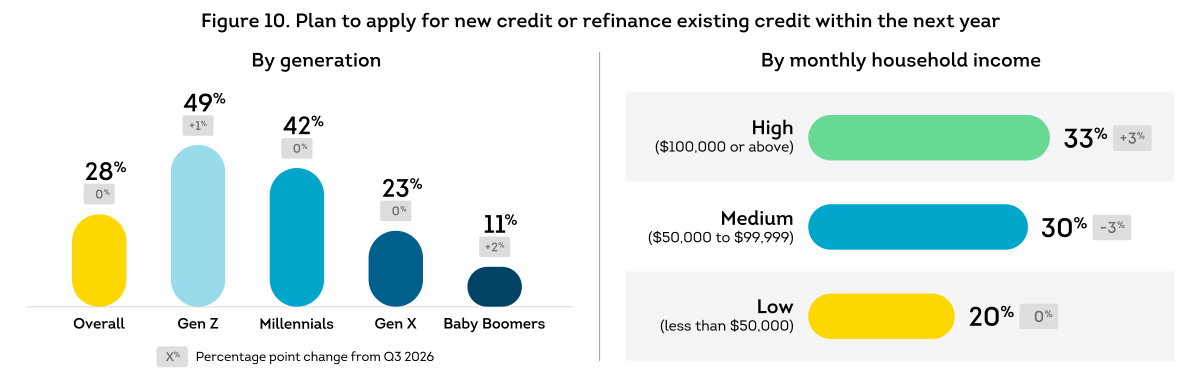
Overall, plans to seek new or refinance existing credit in the next year fell two percentage points year  over year to 28% in Q4 2026. Gen Z tied for the highest intent to apply compared to other generations  and believe they have adequate access to credit to help them achieve their goals (see Figures 9 and 10).  In fact, over half (58%) believed they’d be approved for a credit or lending product if they needed one.

At the same time, rising interest rates this year have largely been taken in stride by US consumers  reflecting a broader pattern of consumers adapting how and when they use credit rather than simply  sitting on the sidelines. Overall, 26% of consumers said rising interest rates would have a high impact on  their plans to apply for credit in the next 12 months, essentially flat from Q4 2025. Another 28% said rising interest rates had no impact on credit plans. Millennials were most impacted by rising interest rates; 31%  said it would have a high impact on credit plans compared to 28% for Gen X, 24% for Gen Z and 20% for  Baby Boomers. Baby Boomers (46%) said rising interest rates had no impact on plans to apply for credit compared to Gen Z (13%), Millennials (14%) and Gen X (28%).

3360617-q4-consumer-pulse-fig8.png
3360617-q4-consumer-pulse-fig9.png
3360617-q4-consumer-pulse-fig10.png

Credit cards dominated planned credit and holiday payment preferences despite rising interest rates

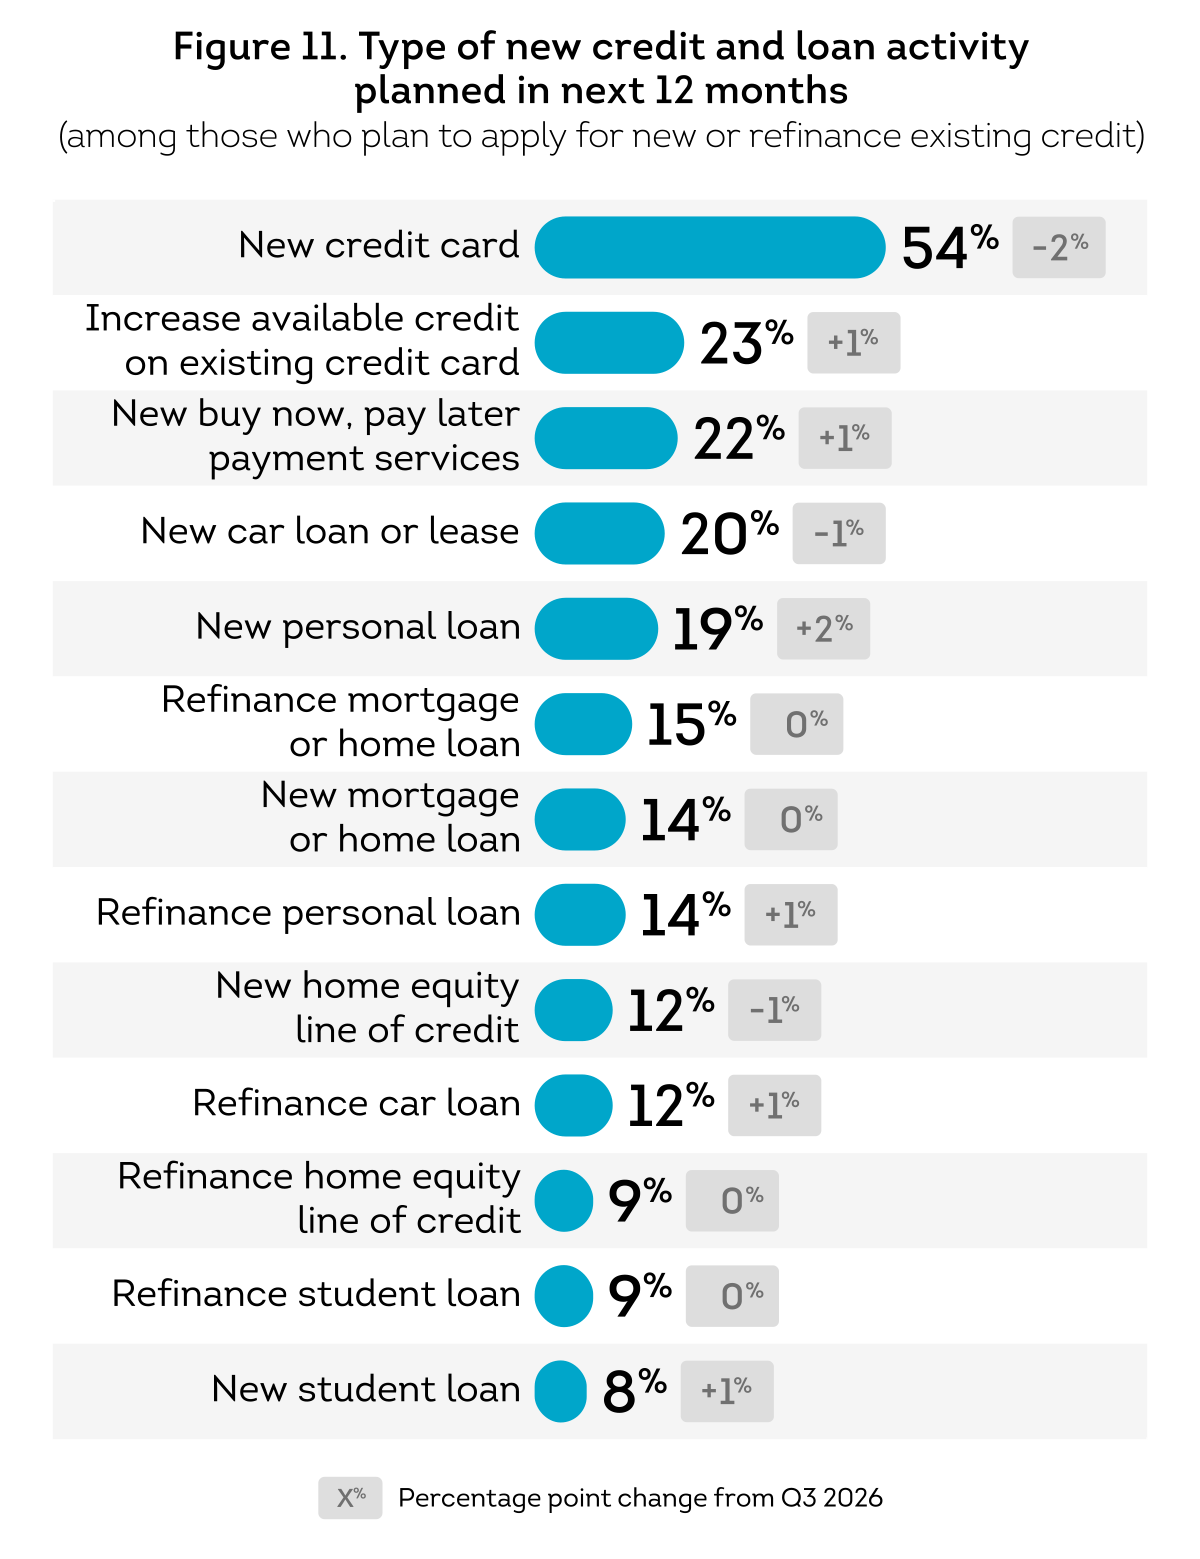
Approximately 178 million US consumers held at least one active credit card at the end of Q3 2026,  up 3.2 million from a year earlier.2 Credit cards maintained the highest interest of those who planned to  apply for credit in the next 12 months (see Figure 11). However, the 54% who planned to apply were flat from Q4 2025. At the same time, those who said they planned to apply for a buy now, pay later (BNPL) service in the next year rose three percentage points YoY, tied for the biggest increase with those planning to apply for a new mortgage and request an increase in available credit for an existing credit card. When it comes to those credit and loan types, Gen Z had the lowest percentage among generations who said they were planning to seek a new credit card (49%) and the highest seeking a BNPL loan (26%).

Credit cards (41%) remained the stated preferred payment type for holiday shopping followed by debit  cards (26%). While debit cards (30%) continued to be Gen Z’s preferred payment method for holiday shopping, that was down eight percentage points from Q4 2025. Credit cards are growing in popularity for Gen Z holiday shopping, up six percentage points YoY to 27% and the biggest increase for this generation. Nearly two in three consumers (64%) said when holiday shopping, they’d consider opening a store credit card for  a discount on their purchases at checkout. On average, shoppers cited a discount of approximately $111  would be sufficient incentive to do so.

3360617-q4-consumer-pulse-fig11.png
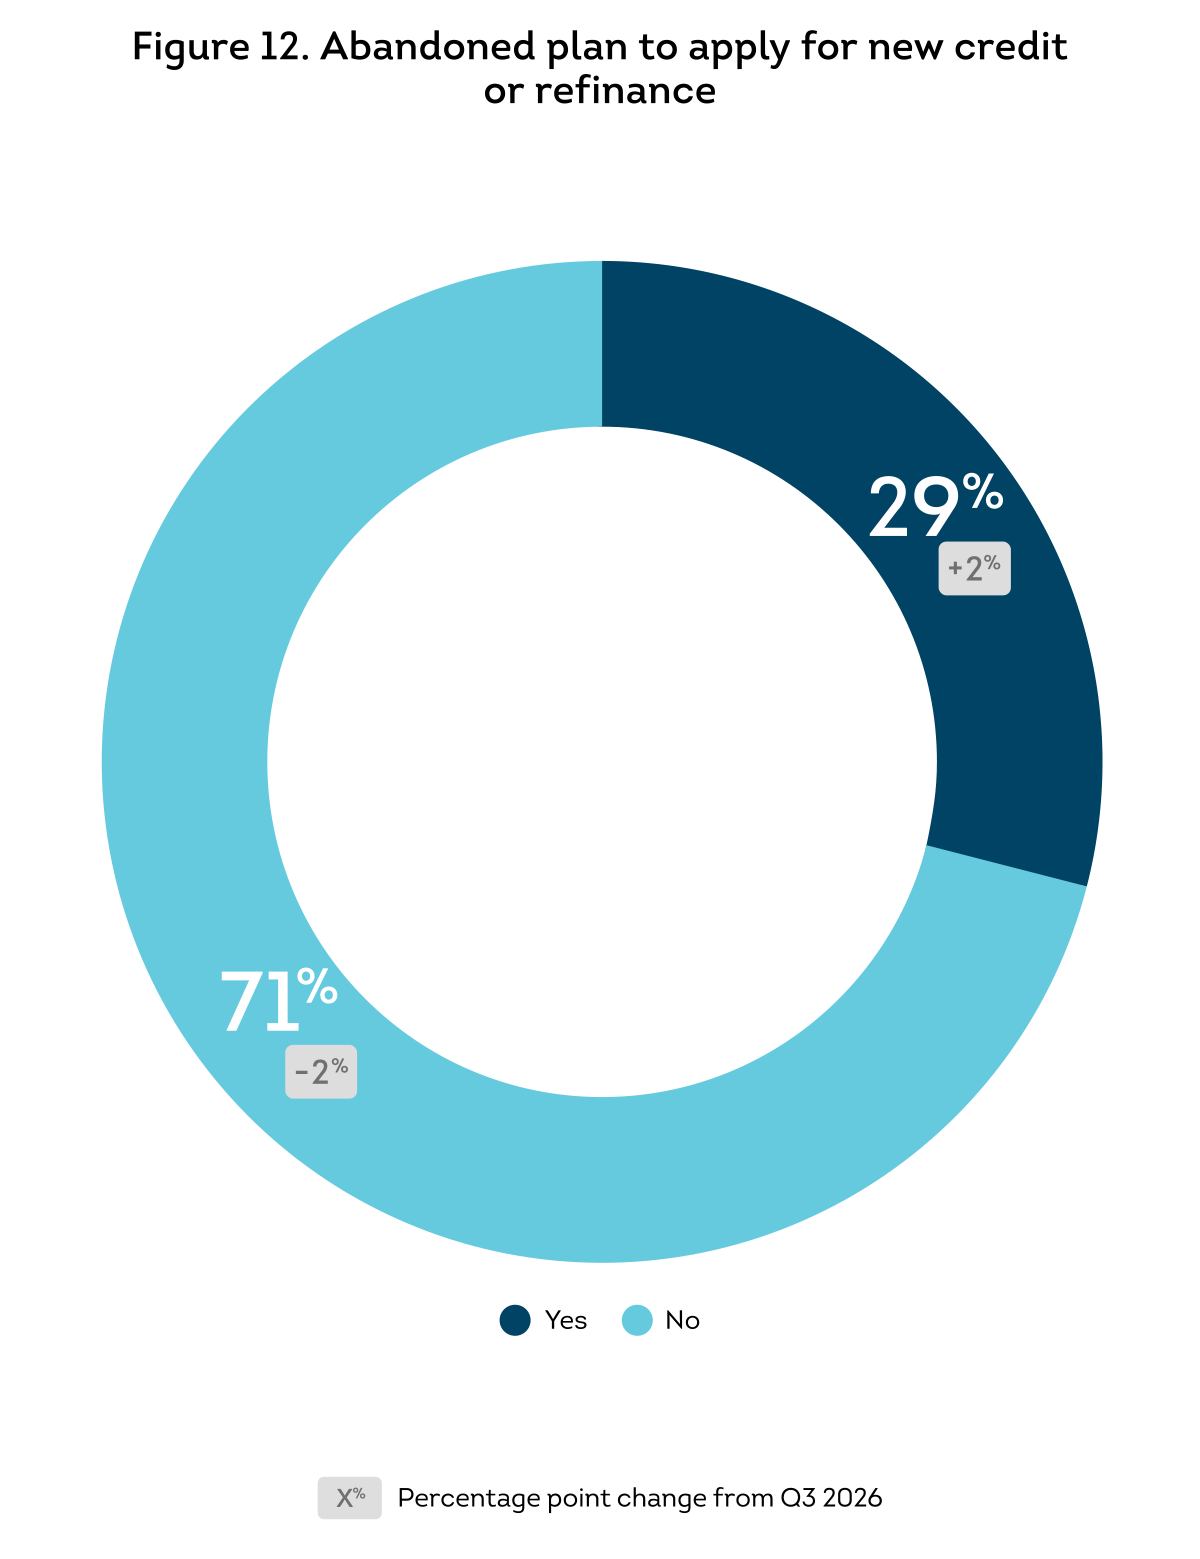
3360617-q4-consumer-pulse-fig12.png
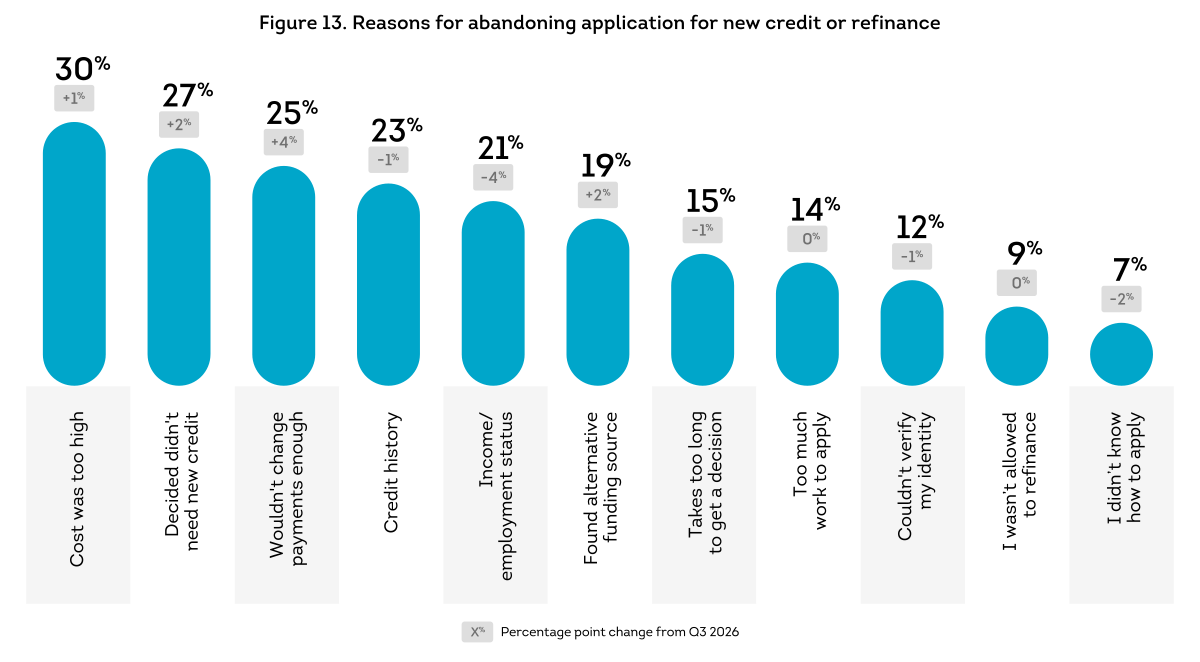
3360617-q4-consumer-pulse-fig13

Consumer Empowerment

Credit monitoring remains an important path to building financial health

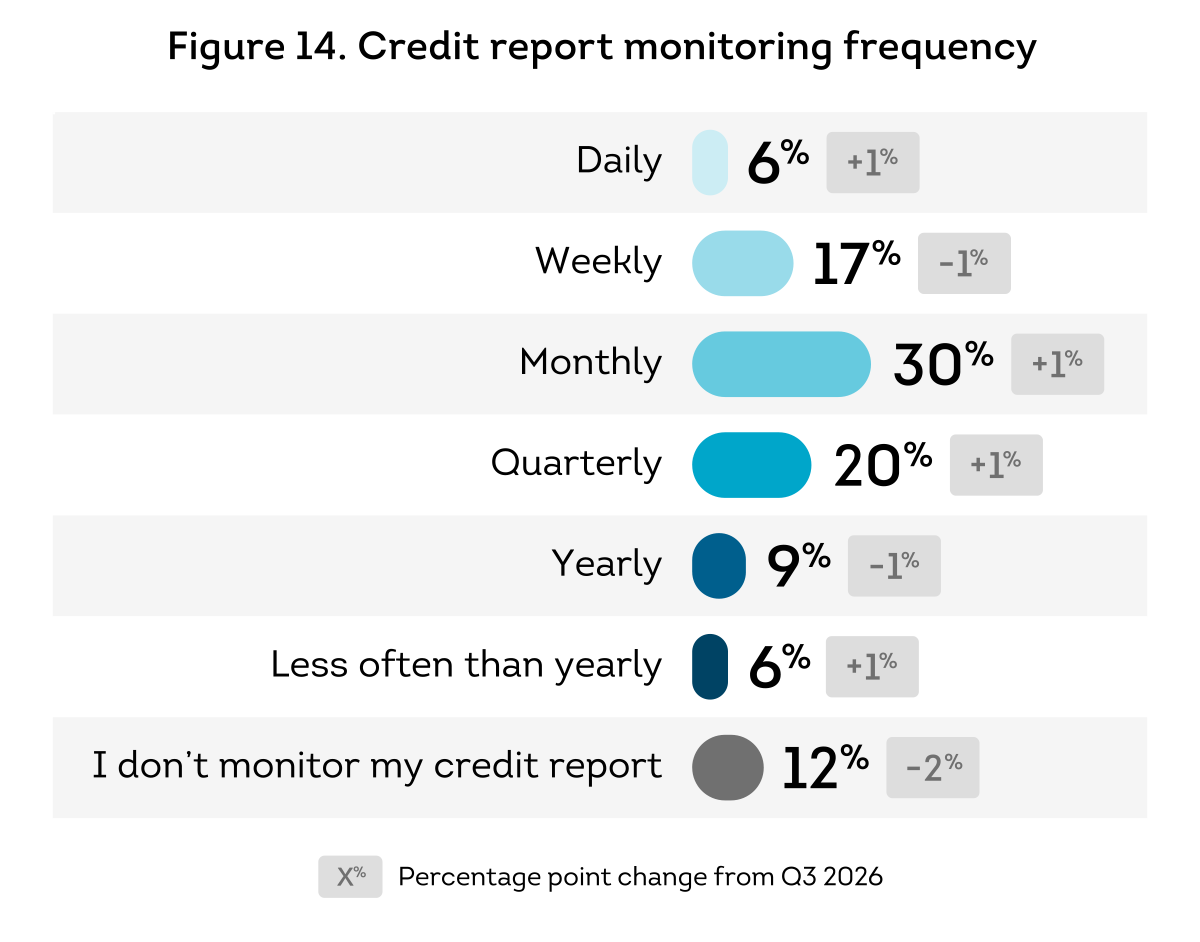
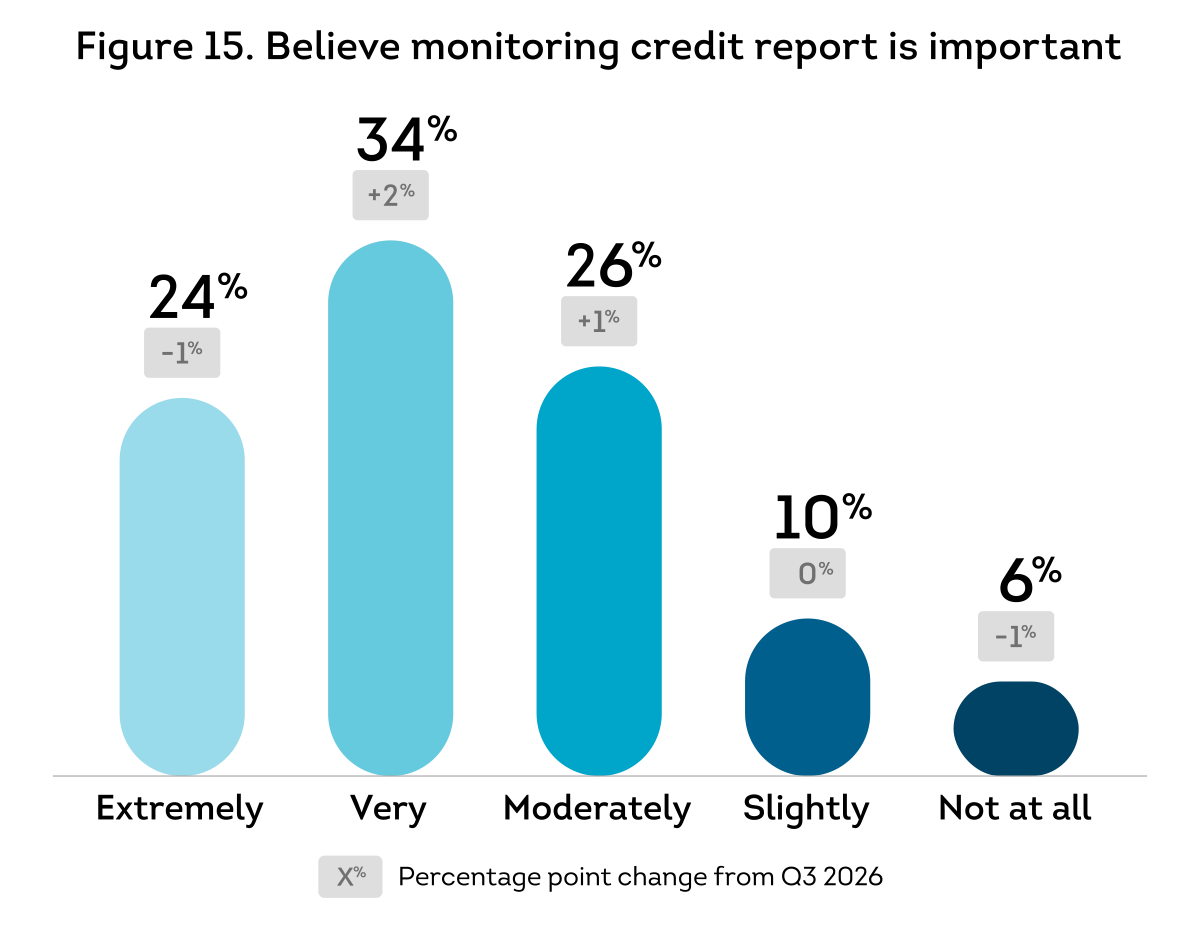
More than half of US consumers believed monitoring their credit reports was extremely or very important (see Figure 15). This closely mirrors the majority (53%) of consumers reporting monitoring their credit at least monthly (see Figure 14). Younger generations appeared most active as Gen Z (67%) and Millennials (60%) reported monitoring their credit at least monthly. Millennials (39%) and Gen Z (35%) were also the two generations who most reported credit score improvement as their reason for credit monitoring. Conversely, Gen X (47%) and Baby Boomers (56%) said their top reason for monitoring their credit reports was to protect against fraud.

3360617-q4-consumer-pulse-fig14
3360617-q4-consumer-pulse-fig15

Consumers are divided about the long-term value of AI

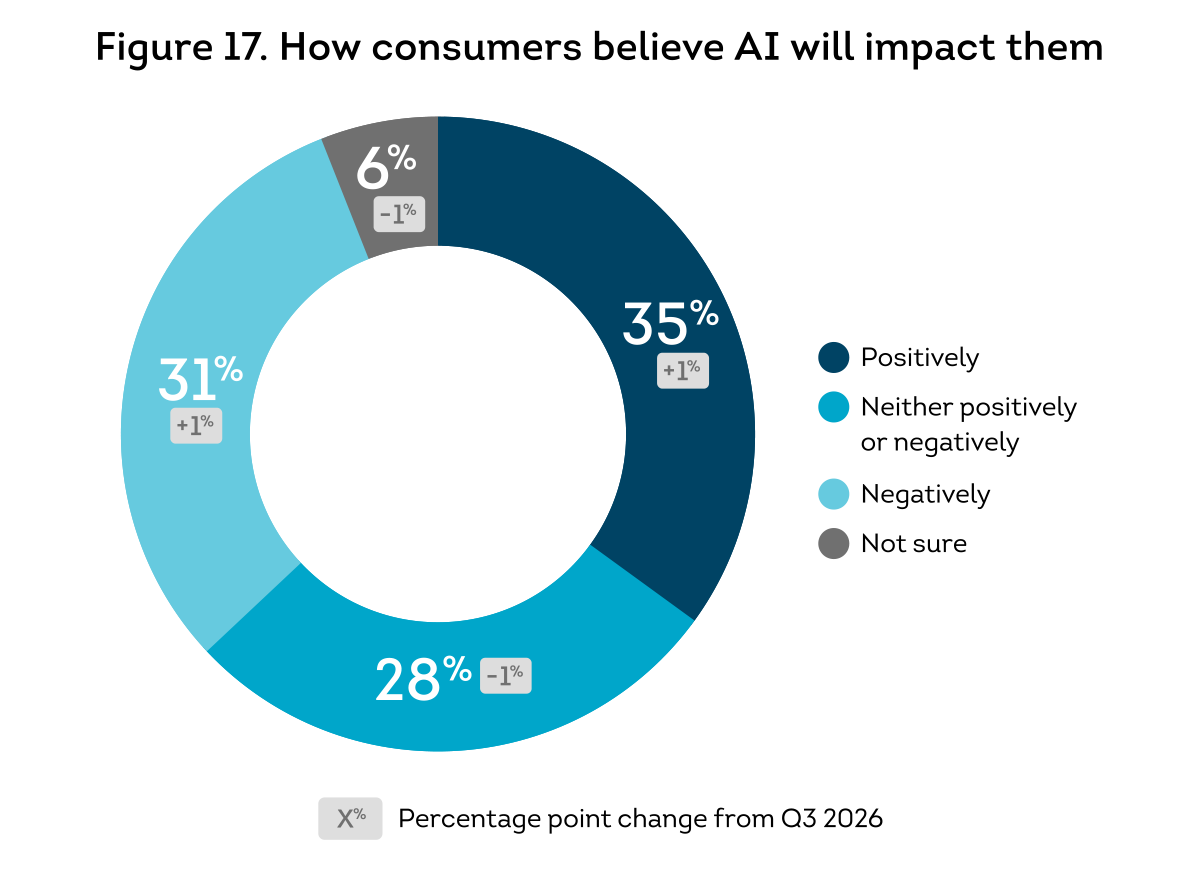
Sentiment about the benefit of AI remained unchanged YoY, with over a third of consumers saying it will positively impact them personally (see Figure 17). At the same time, those who said it would negatively impact them rose two percentage points from a year ago to 31%. Younger consumers were significantly more optimistic about the benefit of AI, led by Millennials (48%) and Gen Z (44%).

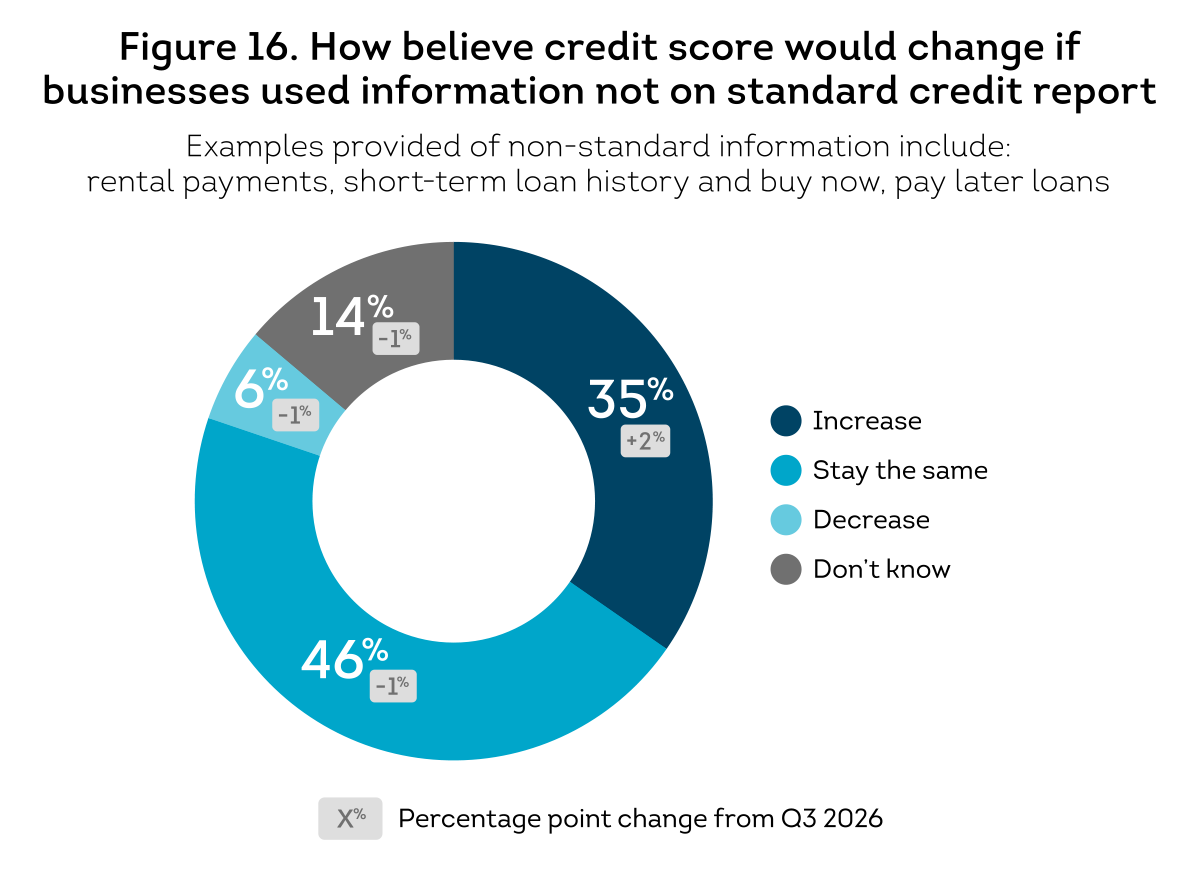
3360617-q4-consumer-pulse-fig16.png
3360617-q4-consumer-pulse-fig17

Identity Protection

Fear of AI-enabled fraud a leading concern for Americans

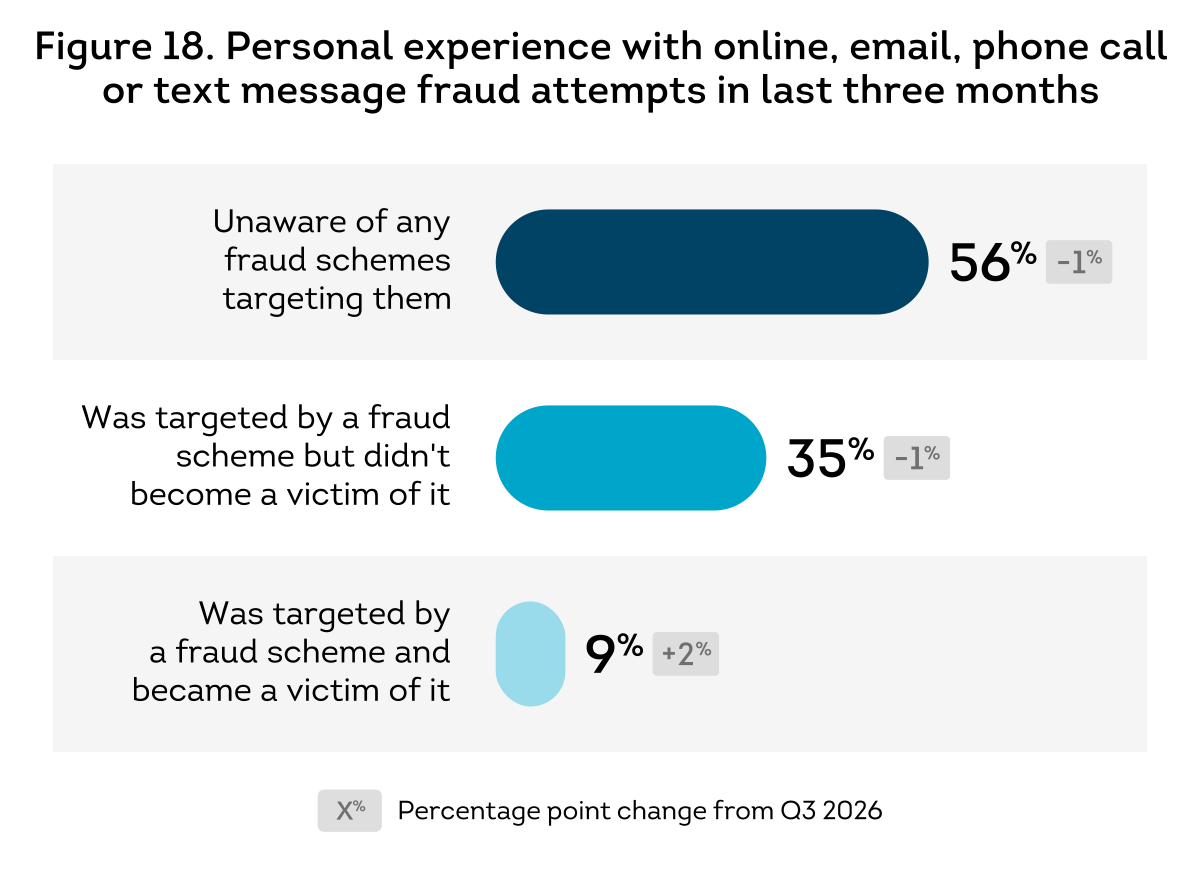
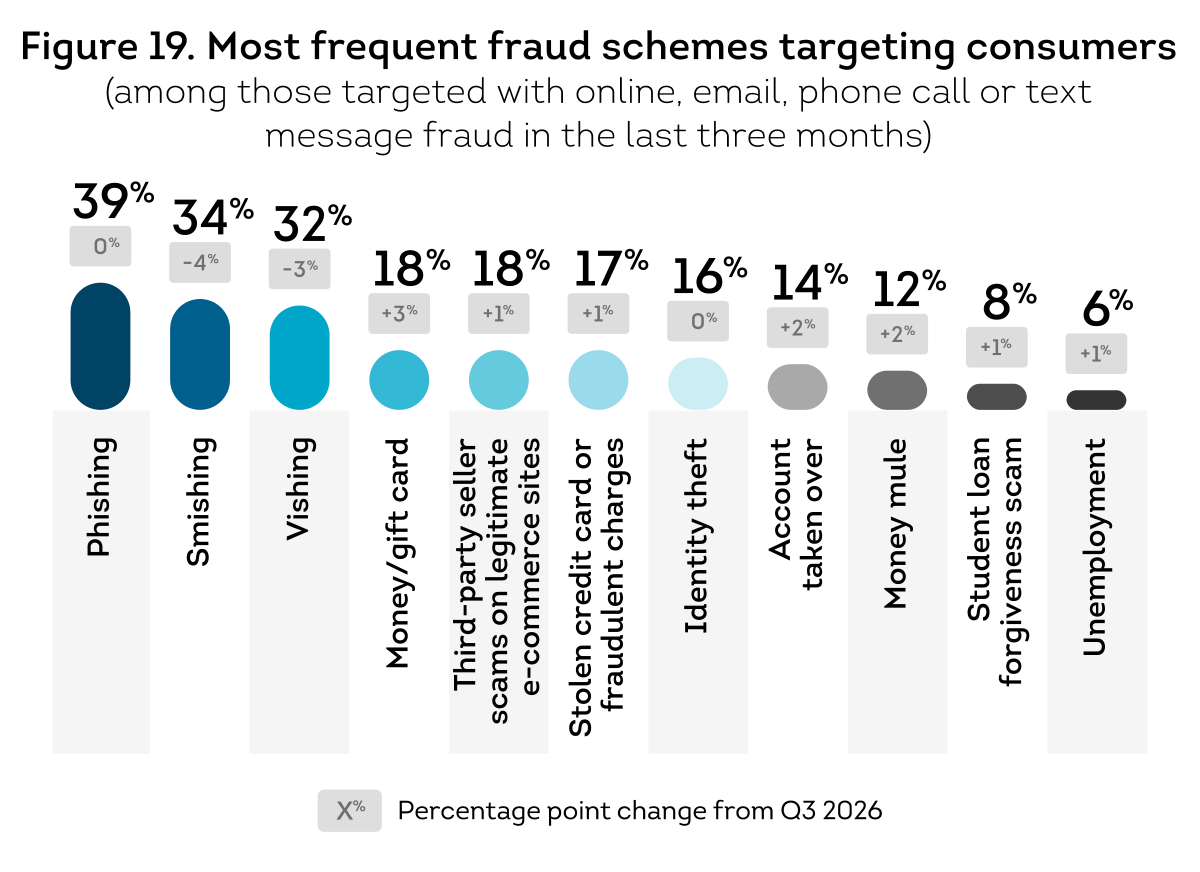
Overall, 44% of consumers said they were targeted by email, online, phone call or text message  fraud in Q4 2026 and 9% fell victim. The three most cited schemes among those targeted were forms of brand impersonation, social engineering and trust manipulation scams (see Figure 19). Consumers appeared concerned AI would make these attacks more dangerous for them personally. When asked to select the top three potential long-term personal impacts of AI, the top choice was the unethical use of AI (37%) followed by privacy and security concerns (35%) and increased identity fraud attempts (25%).

Consumer data exposure has become all too familiar to consumers. In addition to experiencing scams directly, nearly a third (30%) of Americans said they were notified details about their identities and/or online accounts were stolen in a data breach in the last three months, unchanged year over year.

3360617-q4-consumer-pulse-fig18
3360617-q4-consumer-pulse-fig19

Response to data breaches leave consumers exposed to future fraud

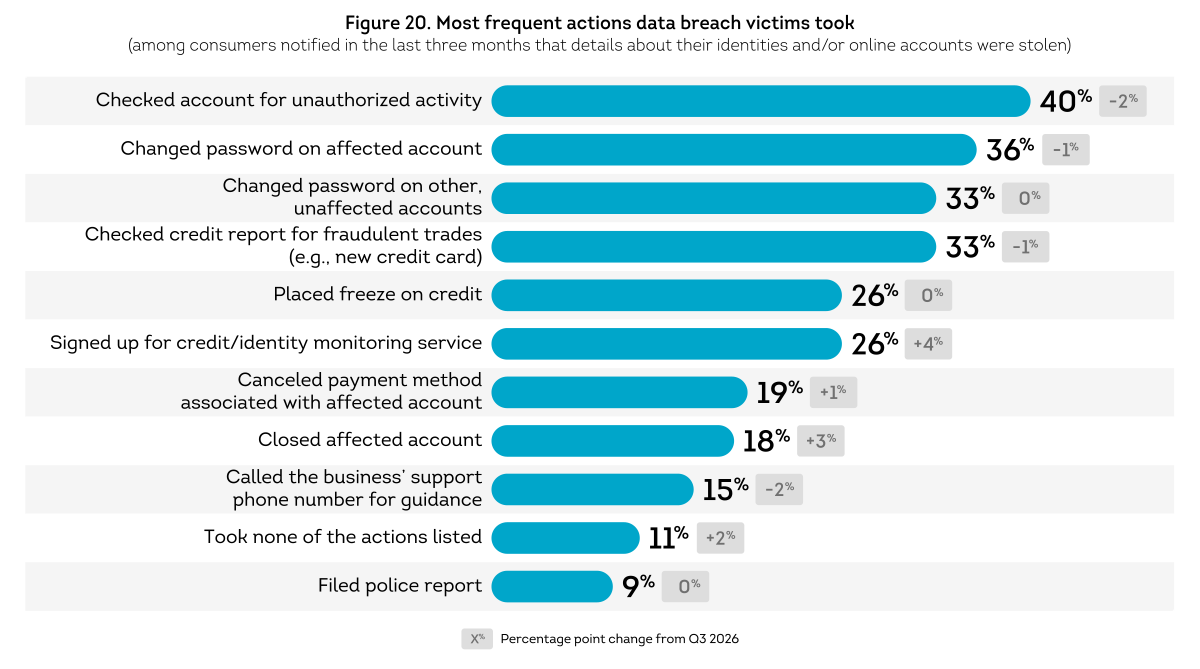
More than half (58%) of consumers said identity theft was a top three cyber threat that most concerned them followed by credit card fraud (49%) and data breaches (41%). However, their responses to a data breach notification in the past three months illustrate the need for better education to minimize their risk of future fraud (see Figure 20). Only a quarter reported taking steps to either monitor or freeze their credit. And just over a third took steps to protect the affected account by changing their passwords.

3360617-q4-consumer-pulse-fig20.png

Consumers continue to take less effective steps to protect themselves from cyber threats

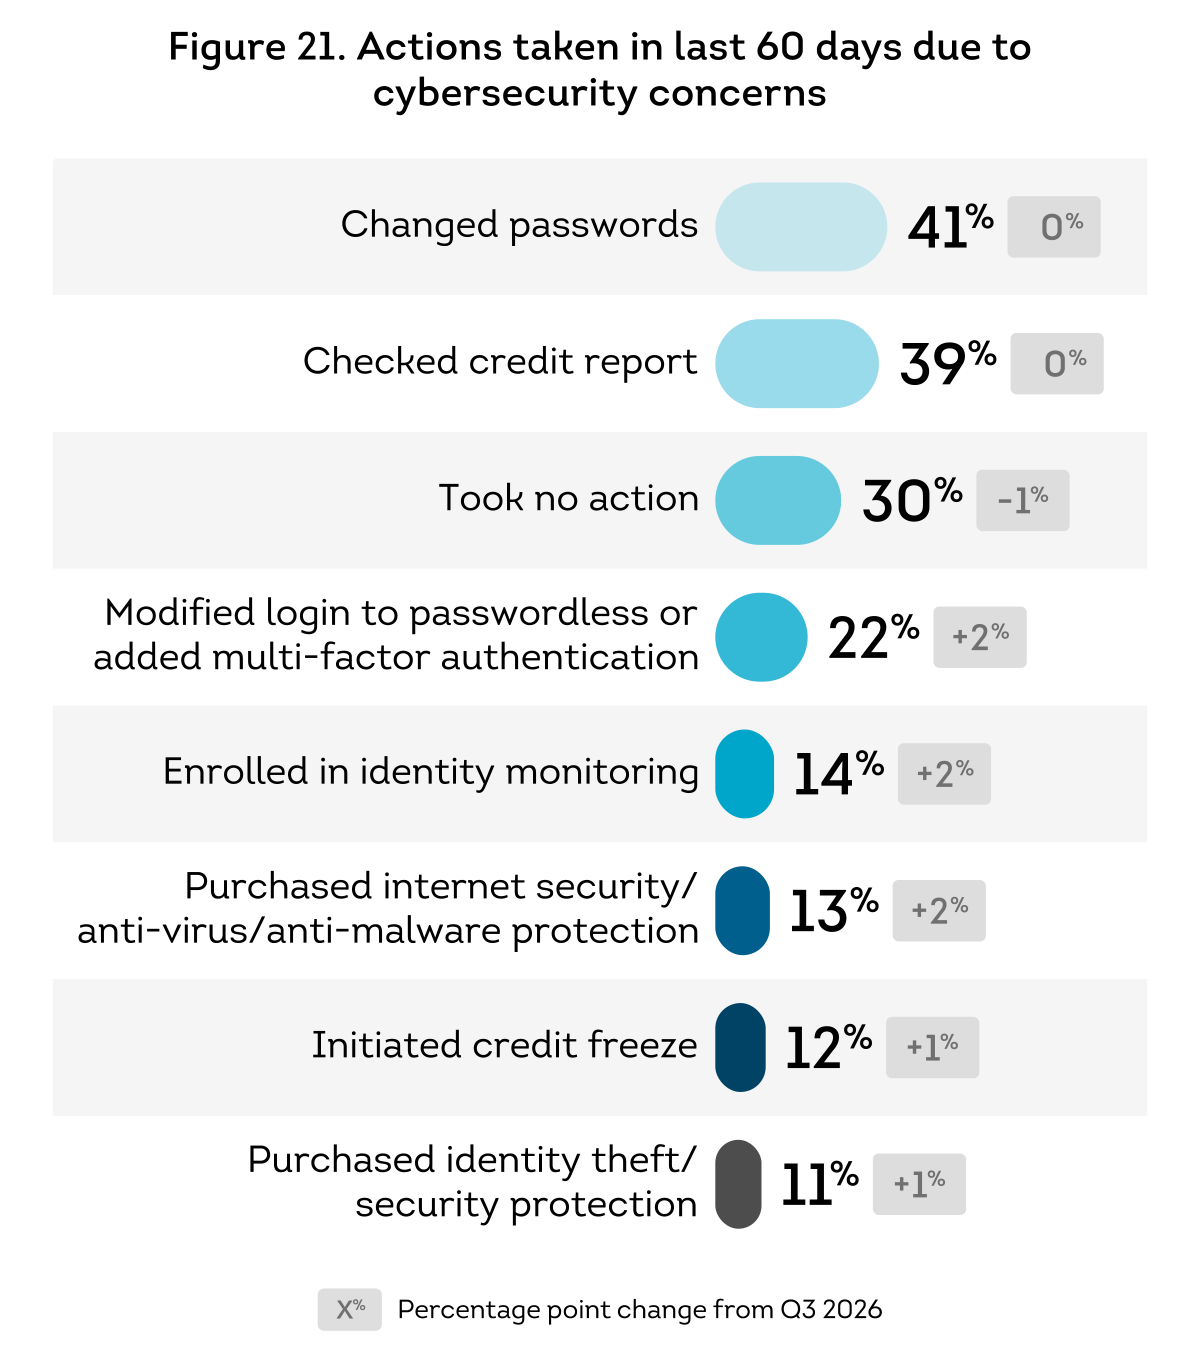
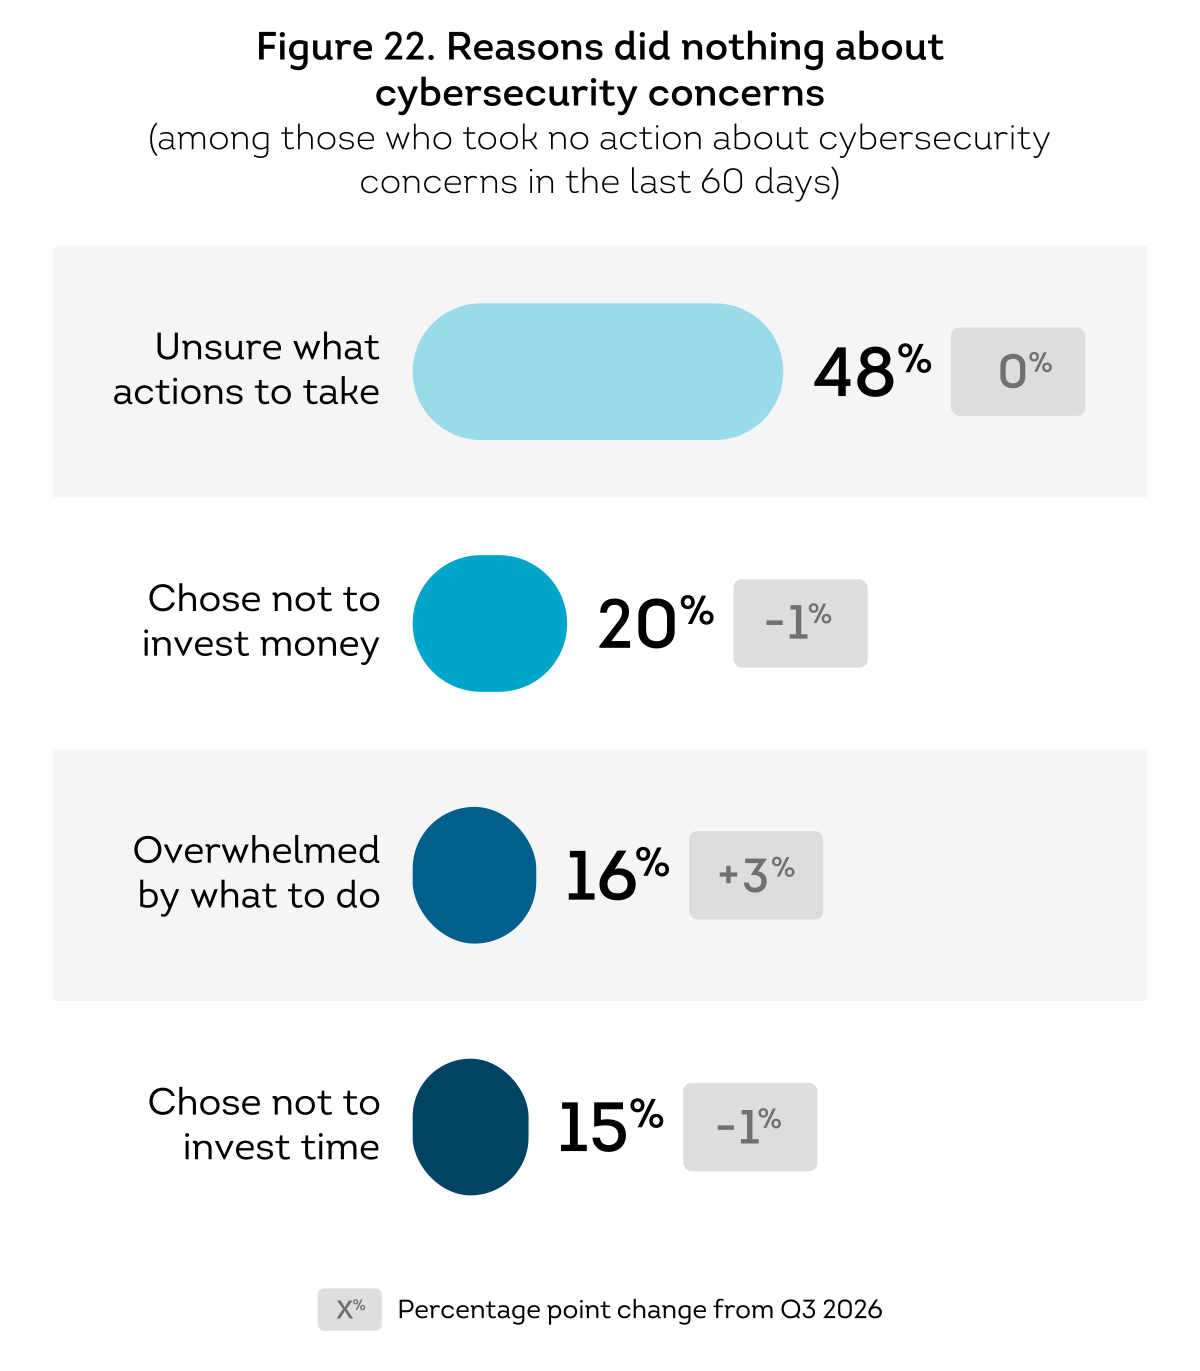
Experience with data breaches and scams has raised awareness of cyber threats. However, consumers took limited steps to ensure their identities and accounts were protected against future attacks (see Figure 21). Rather than implementing stronger account protection with passwordless or multifactor authentication,  more consumers reported simply changing their passwords in response to cyber threat concerns.  Likewise, more consumers reported checking their credit reports over initiating a credit freeze. Nearly  a third said they took no action at all, mainly because they reported not knowing what to do.

3360617-q4-consumer-pulse-fig21.png
3360617-q4-consumer-pulse-fig22.png

Empowering consumers to play a more active role in fraud prevention

Consumer responses to cyber threats and fraud risks call for greater education on the part of organizations, including how to avoid impersonation scams, what type of communication should be trusted and encouraging the use of passkeys to replace easily exploitable credentials like passwords for online accounts.


End Notes

1 American Automobile Association, Average National Fuel Prices as of October 26, 2026
2 TransUnion, Q3 2026 Credit Industry Insights Report, November 2026

About the research

TransUnion, in partnership with third-party research provider Dynata, conducted an online survey of 3,000 US adults age 18 and older Oct.1–12, 2026. Participants were surveyed using an online research panel method across a combination of desktop, mobile and tablet devices. Survey questions were administered in English. All states were represented in the survey responses.

To ensure general population sample representativeness across United States resident demographics, the survey included quotas to balance responses to the census statistics on the dimensions of age, gender, household income, race and region. Generations were defined in this research as follows: Gen Z, 18–29 years old; Millennials, 30–45; Gen X, 46–61; and Baby Boomers, age 62 and above. Household income ranges were defined as low-income (annual income less than $50,000), middle-income ($50,000–$99,999) and high-income ($100,000 or above). These research results are unweighted and statistically significant at a 95% confidence level within ±1.8 percentage points, based on the calculated margin of error. Please note some chart percentages may not add up to 100% due to rounding or multiple answers being accepted.

For Consumer Pulse Studies worldwide, visit 
transunion.com/consumer-pulse-study

Consumer Pulse Report image

US Report Library

Detailed results from our study.

Consumer Pulse Infographic image

Global Infographic Library

Visual highlights of results.

Consumer Pulse Report image

Video Library

Highlights of results and key takeaways.

International Studies

Disclaimer: The information posted here was accurate at the time it was initially published. We do not guarantee the accuracy or completeness of the information provided. The information contained here is provided for educational purposes only and does not constitute legal or financial advice. You should consult your own attorney or financial adviser regarding your particular situation. For complete details of any product mentioned, visit transunion.com. This site is governed by the TransUnion privacy policy located here.